Sample Data
Click the link below to see the PDF of general sample data.
| detailed_pdf_sheet1.pdf |
Click the link below to see the PDF of detailed sample data.
| detailed_pdf.pdf |
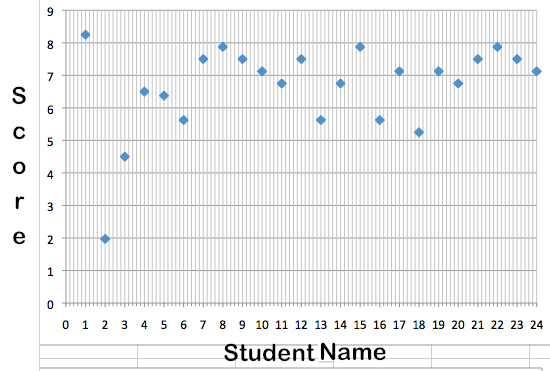
This is a graph plotting the students total score on the 9-point grading scale. (achievement data)
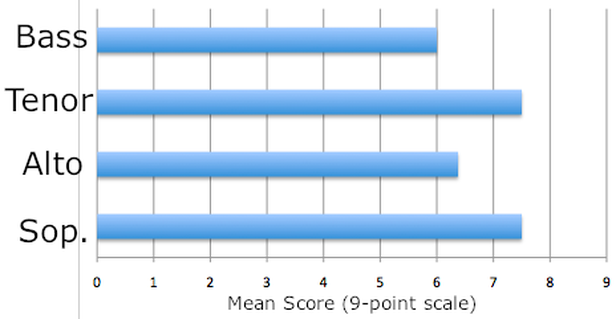
This example of demographic data shows the rubric score mean of each section. In choir, it is more helpful to use the voice section demographic instead of the gender as it more specifically directs the teacher to the group of people in need of the most help. (demographic & achievement data)
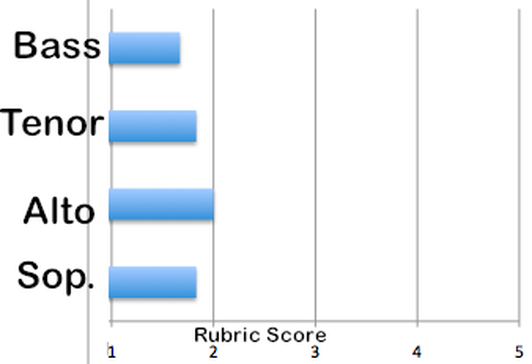
This chart shows the mean rubric score of pitch accuracy by section. (demographic & achievement data)
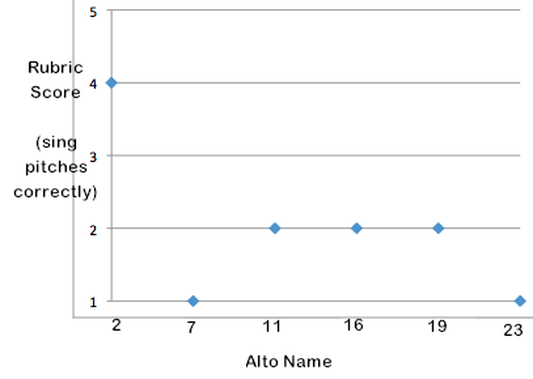
Since the altos had the lowest score in pitch accuracy, I plotted each of the individual alto's score for that objective. As you can see, the mean score was lowered because of an outlier. Now I know that 5 of 6 altos are doing well and student 2 needs further teaching on pitch accuracy. (demographic & achievement data)
Click here to continue to the action plan.
